|
|
||
|---|---|---|
| notebooks | ||
| readme_data | ||
| skripts | ||
| .gitignore | ||
| LICENSE.txt | ||
| README.md | ||
| requirements.txt | ||
README.md
HSMA Data Science and Analytics SS2024
This project was developed through the Data Science and Analytics course at the Mannheim University of Applied Sciences. A data science cycle was taught theoretically on the basis of lectures and implemented practically in the project.
Analysis of cardiovascular diseases using ECG data
Table of Contents
About
Cardiovascular diseases refer to a group of diseases that affect the heart and blood vessels and represent a significant global health burden. They are a leading cause of morbidity and mortality worldwide, making effective prevention and management of these diseases critical. Physical examinations, blood tests, ECGs, stress or exercise tests, echocardiograms and CT or MRI scans are used to diagnose cardiovascular disease. (source: https://www.netdoktor.de/krankheiten/herzkrankheiten/, last visit: 15.05.2024)
An electrocardiogram (ECG) is a method of recording the electrical activity of the heart over a certain period of time. As an important diagnostic technique in cardiology, it is used to detect cardiac arrhythmias, heart attacks and other cardiovascular diseases. The ECG displays this electrical activity as waves and lines on a paper or screen. According to current screening and diagnostic practices, either cardiologists or physicians review the ECG data, determine the correct diagnosis and begin implementing subsequent treatment plans such as medication regimens and radiofrequency catheter ablation. (https://flexikon.doccheck.com/de/Elektrokardiogramm, last visit: 15.05.2024)
The project uses a dataset from a 12-lead electrocardiogram database published in August 2022. The database was developed under the auspices of Chapman University, Shaoxing People's Hospital and Ningbo First Hospital to support research on arrhythmias and other cardiovascular diseases. The dataset contains detailed data from 45,152 patients, recorded at a sampling rate of 500 Hz, and includes several common rhythms as well as additional cardiovascular conditions. The diagnoses are divided into four main categories: SB (sinus bradycardia), AFIB (atrial fibrillation and atrial flutter), GSVT (supraventricular tachycardia) and SR (sinus rhythm and sinus irregularities). The ECG data was stored in the GE MUSE ECG system and exported to XML files. A conversion tool was developed to convert the data to CSV format, which was later converted to WFDB format. (source: https://doi.org/10.13026/wgex-er52, last visit: 15.05.2024)
The data set used in this project was divided into four main groups: SB, AFIB, GSVT and SR. The choice of these groups is based on the results from the paper “Optimal Multi-Stage Arrhythmia Classification Approach” by Jianwei Zheng, Huimin Chu et al., this choice in turn is based on expert opinions from 11 physicians. Each group represents different cardiac arrhythmias that can be identified by electrocardiographic (ECG) features. (source: https://rdcu.be/dH2jI, last visit: 15.05.2024)
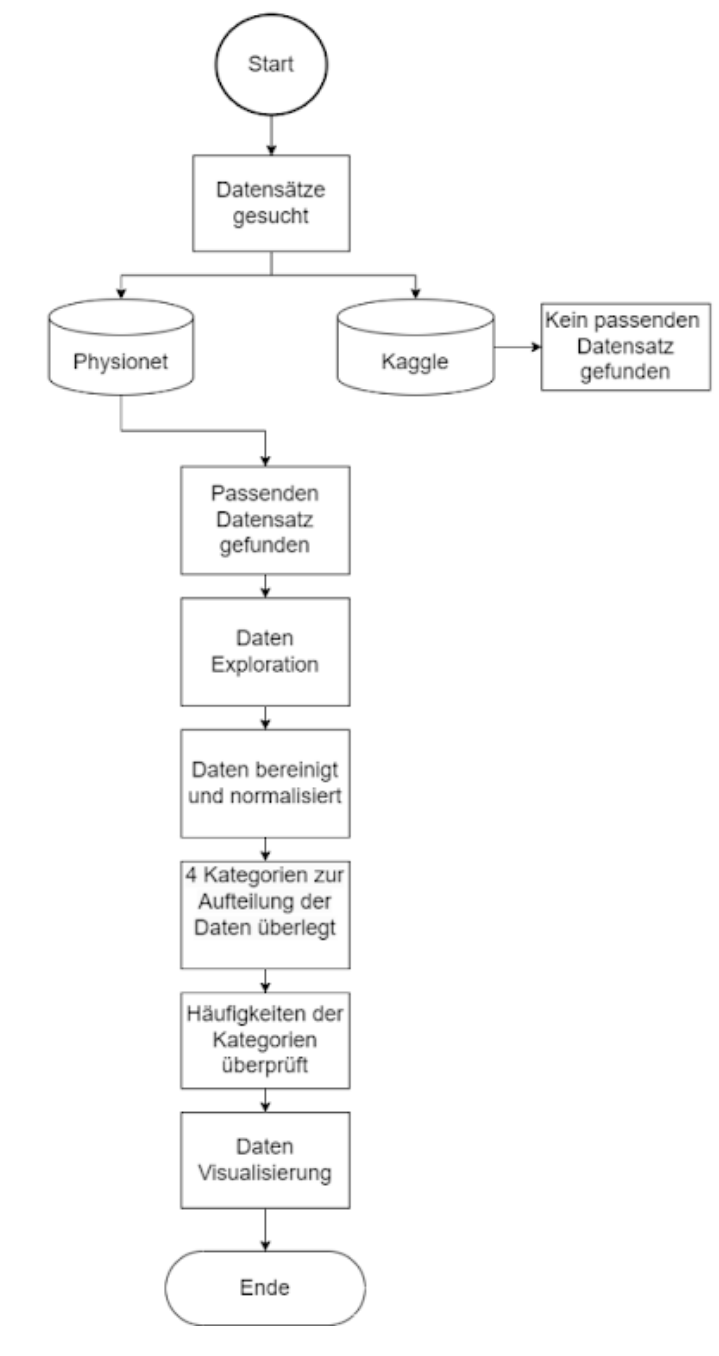
The data provision provides for the following points, which can be taken from the diagram.
Getting Started
This project was implemented in Python. To use the project, all packages listed in the requirements.txt file need to be installed first. After that, you can interact with the project as follows:
- Ensure you have 10GB of available space.
- First, visit the website and download the dataset (https://doi.org/10.13026/wgex-er52, last visit: 15.05.2024).
- Extract the data.
- Open the generate_data.py script and adjust the "project_dir" path to point to the downloaded data.
- Run the generate_data.py script as the main file. This will generate several pickle files, which may take some time.
- You can now use the notebooks by adjusting the "path" variable in the top lines of each notebook to point to the pickle files.
Usage
- coming at the end of the Project...
Progress
- Data was searched and found at : (https://doi.org/10.13026/wgex-er52, last visit: 15.05.2024)
- Data was cleaned
- Demographic data was plotted
- Start exploring signal processing
Contributing
- coming at the end of the Project...
License
This project is licensed under the MIT License.
Acknowledgements
We would like to especially thank our instructor, Ms. Jacqueline Franßen, for her enthusiastic support in helping us realize this project.
Contact
- Klara Tabea Bracke
- Arman Ulusoy (3016148@stud.hs-mannheim.de)
- Nils Rekus
- Felix Jan Michael Mucha (felixjanmichael.mucha@stud.hs-mannheim.de)
